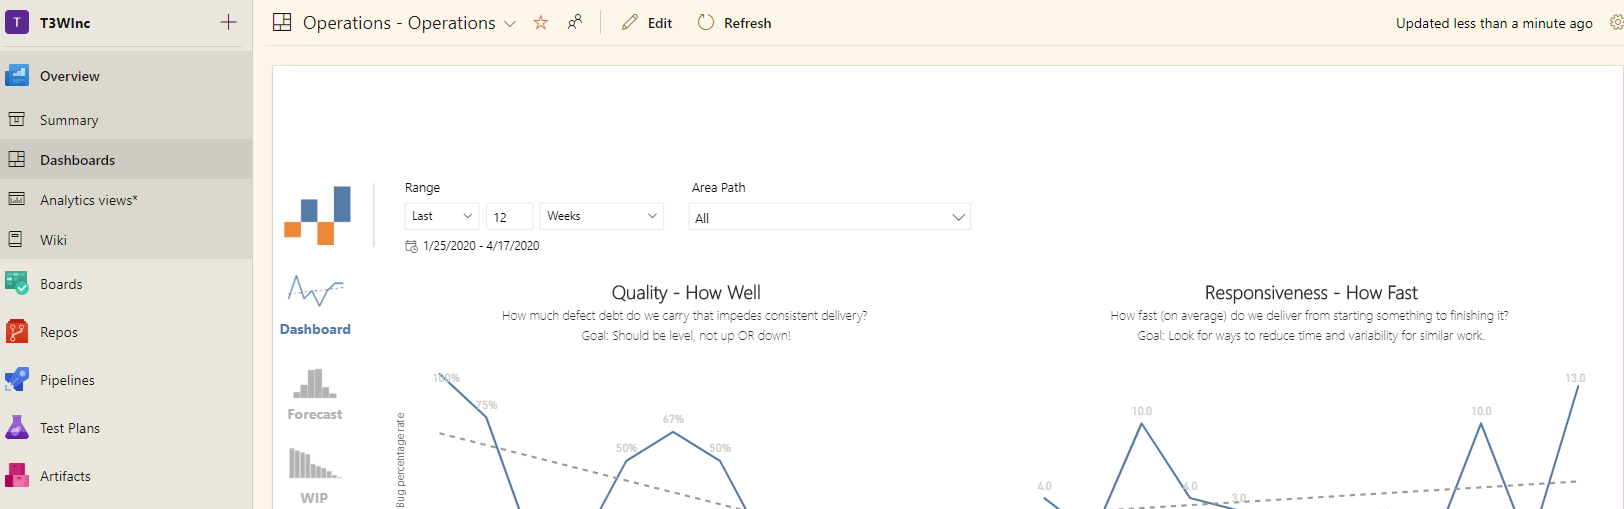
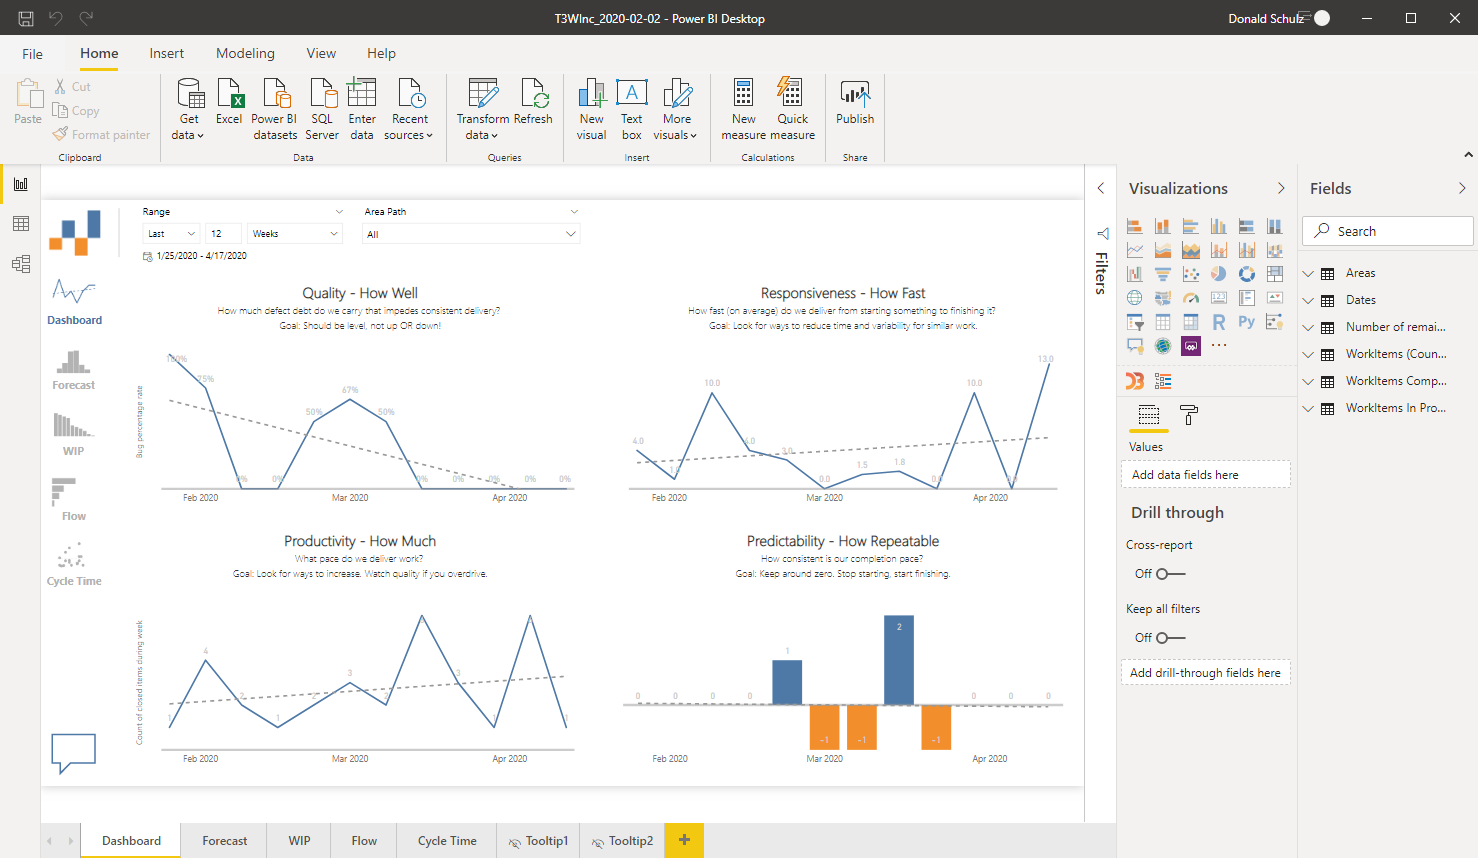
I have been working with Power-BI lately using data from my Azure DevOps Service. There are provided for us a number of pre build views that you can use in both the Cloud and the on premise version of Azure DevOps Server Update 1 and higher. But what really got me going was a set of templates that are available in the Marketplace called FlowViz. Basically when you install this extension if gives you two Power BI templates, one for Scum and one for Agile. You load the data using an OData connection and you get this beautiful report of 5 pages with about about 4 charts on each page. It really is amazing.
Although this is all pretty cool, I am viewing this from within the Power BI Desktop tool. Where I would like to view this report is on a Dashboard page on my Azure DevOps Instance. That is what this post is all about, getting it from this Power BI Desktop tool to getting it onto an Azure DevOps Dashboard page.
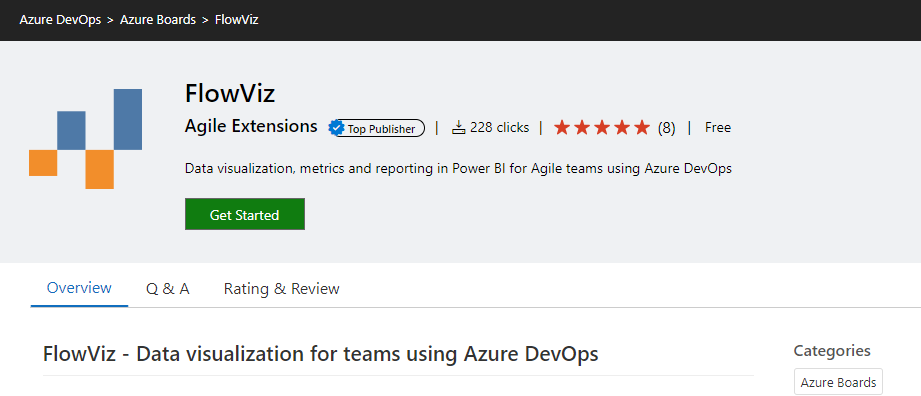
- First we will start with downloading the FlowViz template from the Marketplace. https://marketplace.visualstudio.com/items?itemName=agile-extensions.flowviz This will consist of two .pbit files which are Power BI templates, the site has some pretty good documentation on getting this setup for your environment so I won’t go over that information here. Follow the instructions on the marketplace page.
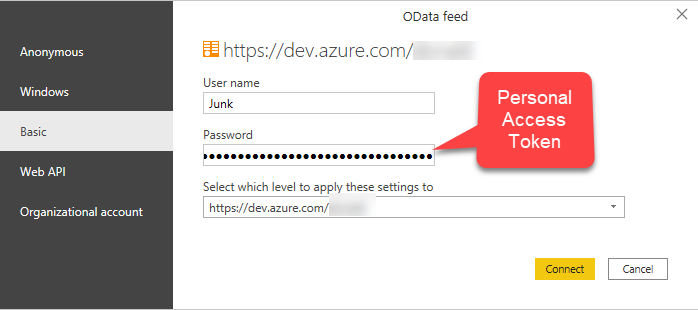
- There is one thing that did take me a little while to figure out and that was the authentication with an OData connection string. The trick is to use the Basic Authentication tab. In there for the User name I just put in my usual Junky name because that part doesn’t even matter, but I use a Personal Access Token (PAT) for the password.
- The charts will fill up like magic because the formulas and data that we are pulling in is all setup to give us some very unique and power data about our work items.
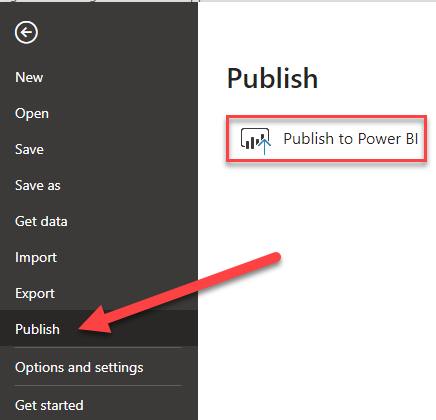
- The next step is to publish the report to your Power BI account in the cloud. When you click on the File menu bar at the top it opens a selection of menu items. Click on the “Publish” menu item . This opens another window with button that says “Publish to Power BI” This will publish your report up to your Power BI in the cloud account, assuming that you have one. There are free and paid plans available. I am doing all this using the free plans, so if you don’t have an account then set one up.
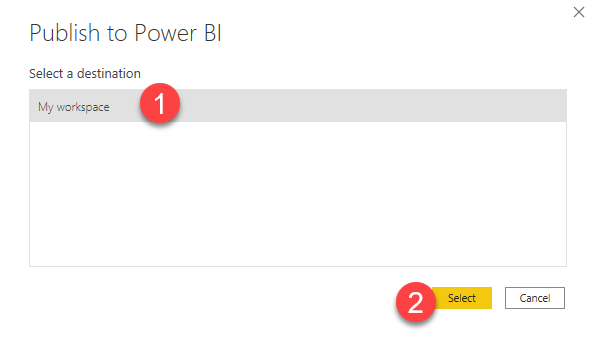
- After you click on the “Publish to Power BI” button you will see “Select a destination” which should default to “My workspace”. If you are using a community free version, this is the only workspace that you can have. Click on the Select button.
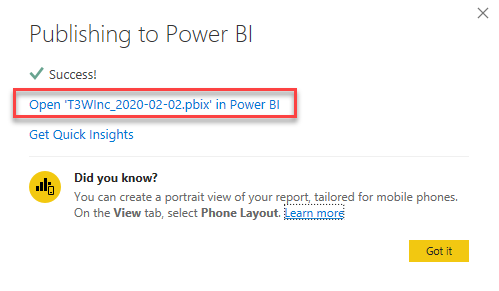
- After it finishes publishing up to the Power BI cloud you should see a link that says to open this report in Power BI. Click on this link and it will take you to your Power BI account in the cloud.
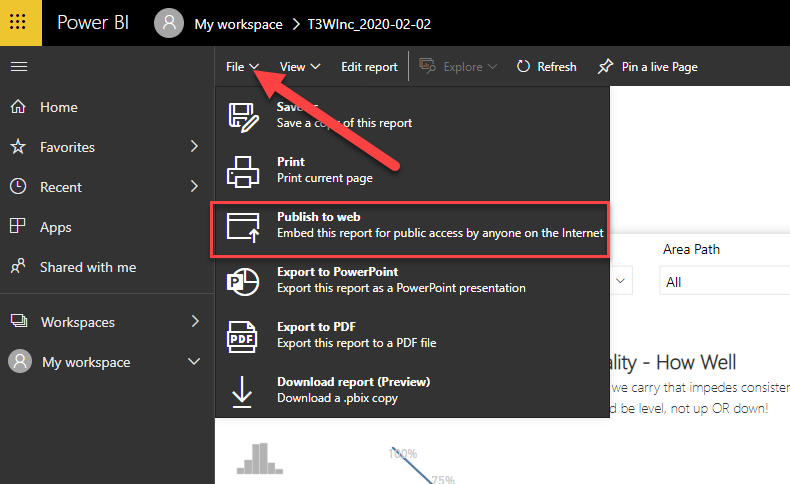
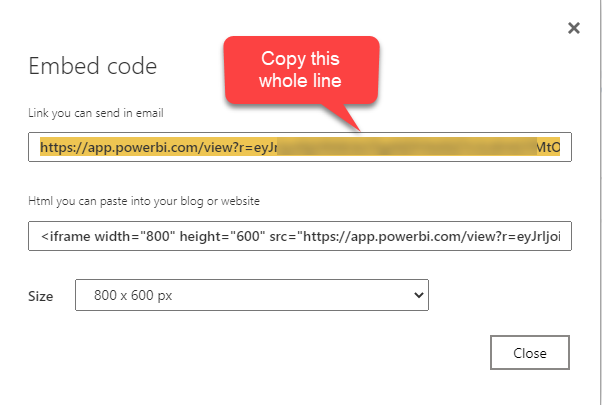
- Now that we have the report on the web version of Power BI it is time to share this with a dashboard on Azure DevOps. Right now everything looks like it did in the Power BI desktop except that it is in the web. Under the file menu you should see an item called “Publish to web”, click on it and a dialog box pops up with a link that includes a token link and an Html snippet that you can paste into a blog or a website in the form of an iframe. We are going to use the first one, the url so copy that whole line.
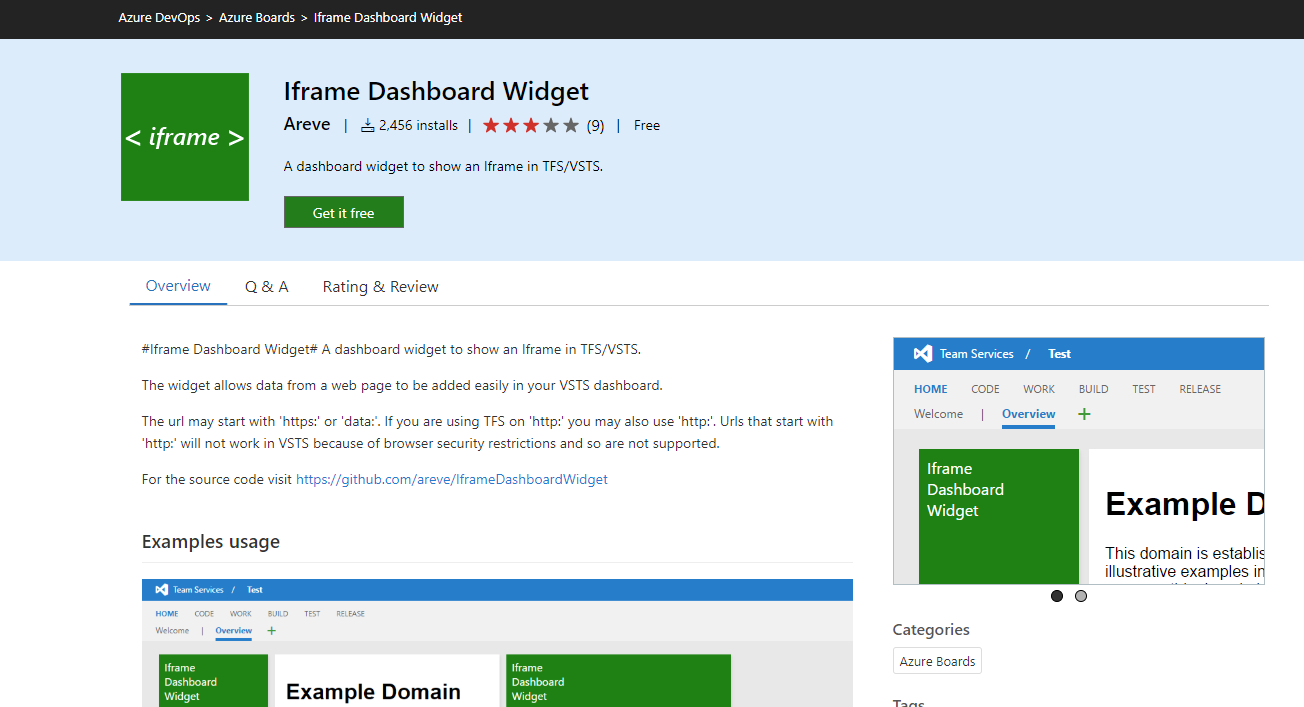
- In order for you dashboard to display the contents of your url and tokens we need to install the iframe Dashboard Widget from the Market Place. You can get this from https://marketplace.visualstudio.com/items?itemName=areve.iframe-dashboard-widget
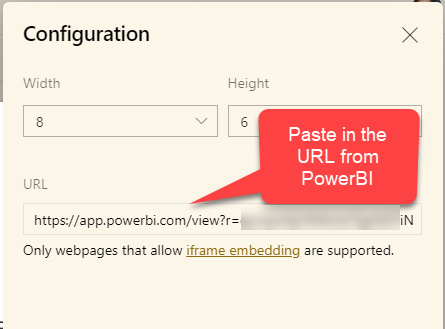
- You will want to start with an empty new dashboard in Azure DevOps as this report will take up the whole page. Add the iframe Dashboard Widget that you installed onto your instance of Azure DevOps onto your Dashboard. In the configuration just paste in the url with the token that we copied in a previous step and set the width and hight. I set my Width to 8 and my Height to 6 and it fit in there perfectly.
- Now you have your report showing up in an Azure DevOps dashboard and all the functionality works as well you can go from page to page, all the data is there.